


 智算多多
智算多多联系我们


关注我们

公众号

视频号
隐私协议用户协议
◎ 2025 北京智算多多科技有限公司版权所有京ICP备 2025150592号-1
该数据集首次提供了覆盖整个亚洲主要水稻生产国(16国)、跨越34年(1990-2023年)、包含三个种植季的连续高分辨率水稻分布信息。
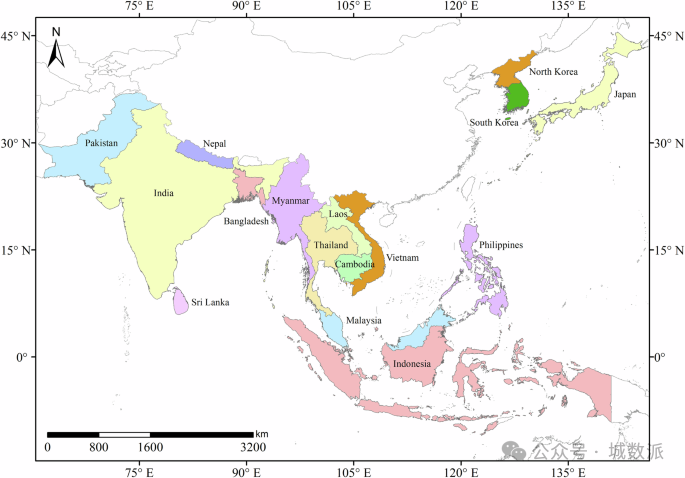
Fig.1 Geographical distribution of the study area, including 16 countries.
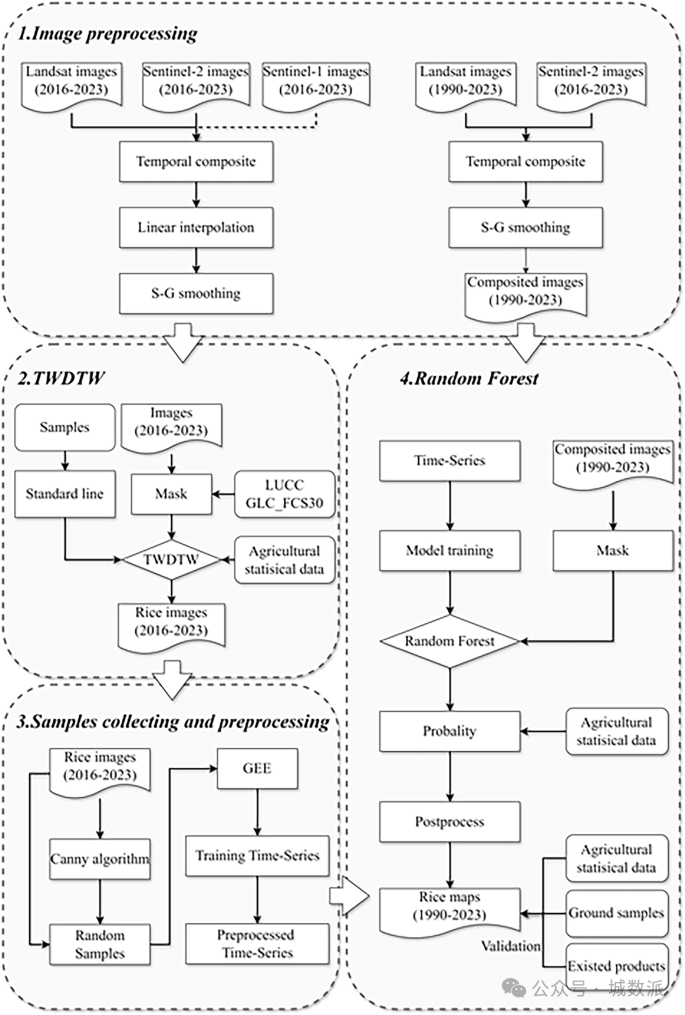
Fig.2 Overall Flowchart of this study to identify Asian rice.
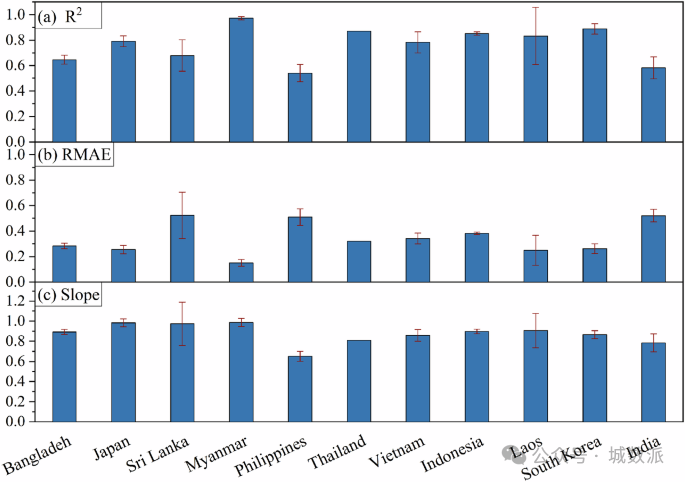
Fig.3 The percentage of effective optical observations within the study area, presented for the periods (a) 1990–2015, (b) 2003–2011 and (c) 2016–2023.
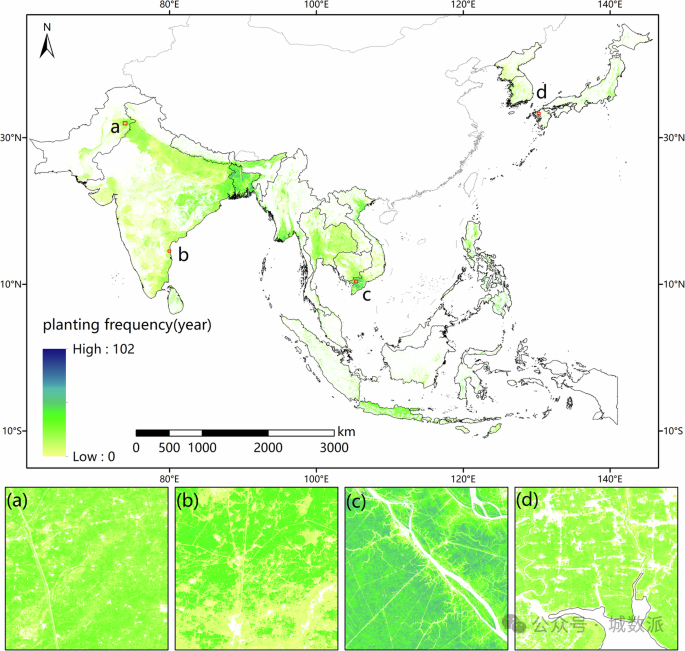
Fig.4 Provincial or municipal comparisons of the identified acreage and statistical acreage of rice in each country, including R², RMAE, and Slope.
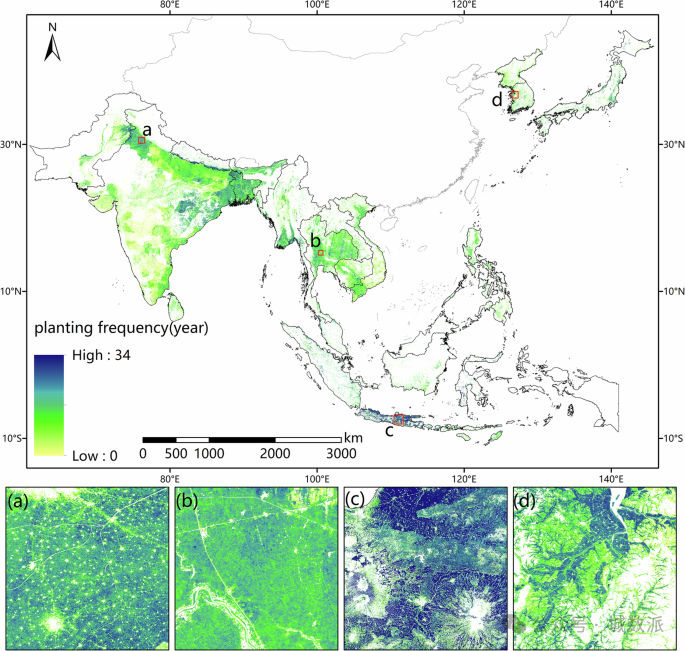
Fig.5 Planting frequency of rice in Asia from 1990 to 2023. Panels (a–d) show a zoomed-in view of the local details in different regions.
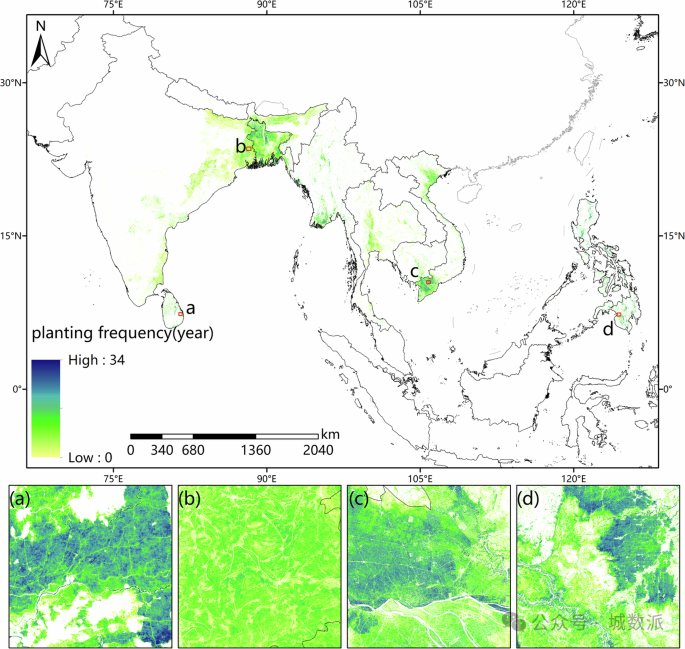
Fig.6 Planting frequency of single-season rice in Asia from 1990 to 2023. Panels (a–d) show a zoomed-in view of the local details in different regions.
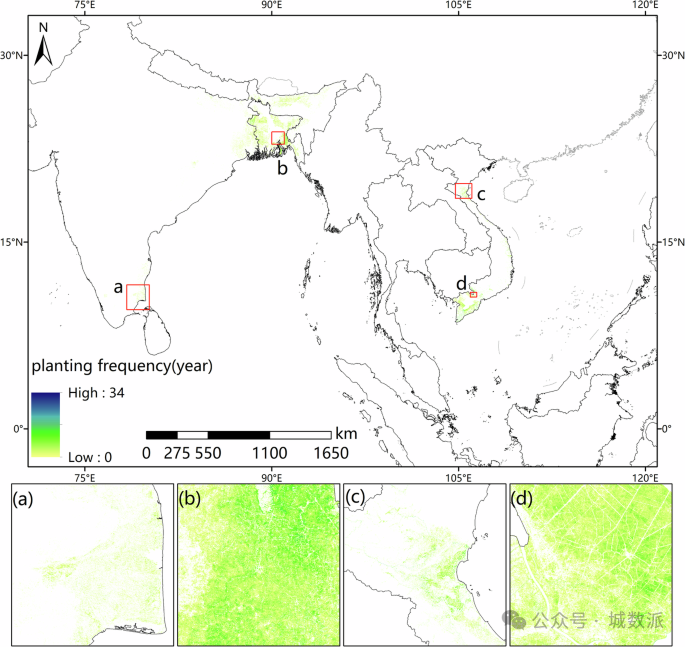
Fig.7 Planting frequency of double-season rice in Asia from 1990 to 2023. Panels (a–d) show a zoomed-in view of the local details in different regions.
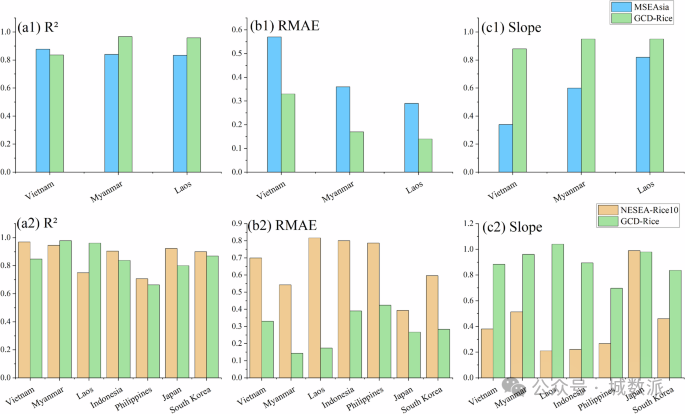
Fig.8 Planting frequency of triple-season rice in Asia from 1990 to 2023. Panels (a–d) show a zoomed-in view of the local details in different regions.
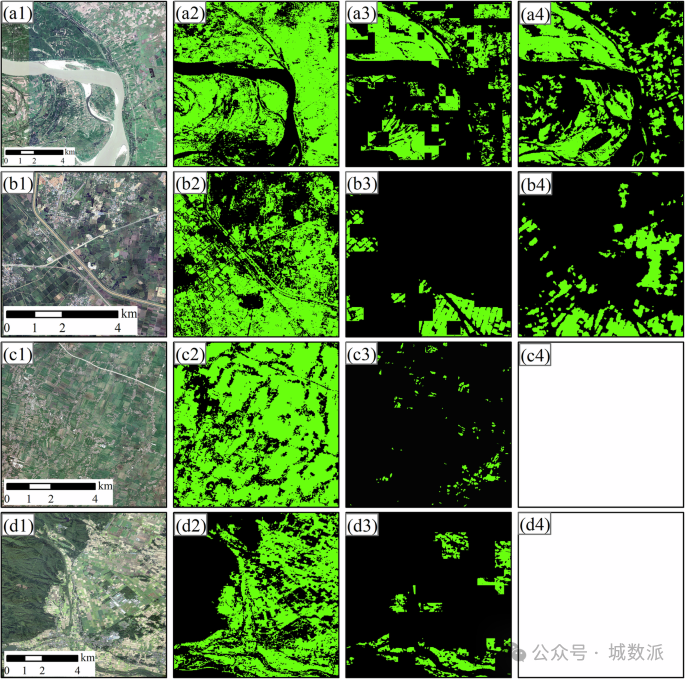
Fig.9 Comparative analysis of rice planting distribution with MSEAsia and NESEA-Rice10 datasets (linear regression: R², RMAE, slope).
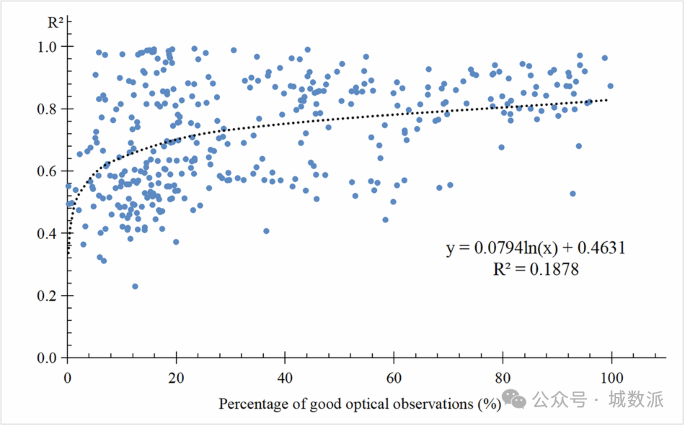
Fig.10 Comparison of this study with two existing products across four regions (MMR, THA, IDN, and JPN), in 2020, 2022, 2019, and 2021, respectively.
智算多多